
India has emerged as the fastest growing major economy as per the Central Statistics Organisation (CSO) and the International Monetary Fund (IMF) and it is expected to be one of the top three economic powers over the next 10-15 years. India’s GDP increased by 7.1 % in 2016-17 and is expected to reach a growth rate of 7 % by September 2018.
1991-2010
The economic crisis of 1991 pushed the country near bankruptcy. The currency devalued and economic reforms were forced upon India. The Indian central bank refused new credit and foreign exchange reserves reduced to such a point that India could barely finance the worth of imports. Under such circumstances, the government was compelled to take tough reforms. The new economic policy (NEP) of 1991 was characterised by liberalisation, globalisation, and privatisation.
The initiation of economic reforms in the 1990s saw India gradually breaking free of the low growth trap which was euphemistically called the “Hindu growth rate” of 3.5% per annum. Real GDP growth averaged 5.7 % per annum in the 1990s, which accelerated further to 7.3 % per annum in the 2000s. A feature of the growth acceleration during the period was that while the growth rate of industry and services increased, the growth rate of agriculture fell. This was because there was no notable technological breakthrough after the “green revolution” of the mid-1960s which saw sharp increase in yields of cereal production in the northern part of India. Consequently, the increase in yield in the 2000s was much lower than that of the 1990s. Notably, the decade of the 2000s encompassed the inflexion point in the growth trajectory with an annual average GDP growth of about 9% for the 5-year period of 2004-08. Growth in all the sub-sectors of the economy, including agriculture, accelerated during this period. However, this growth process was interrupted by the global financial crisis. Subsequently, the average growth slowed down to 7.8 % during 2009-11 with a noticeable slowdown in both agriculture and industry. The slowdown in GDP growth in FY12 can mainly be attributed to high interest rates, inflation and a significant contraction in industrial production.
As a process of restructuring, while the gross value added in organised manufacturing increased by 8% per annum at current prices, employment fell by 1.5% per annum during 1995-2003. Subsequently, during 2004-09 gross value added growth accelerated to 20% per annum at current prices and employment increased by 7.5% per annum.
FDI was gradually allowed in almost all sectors, except a few on grounds of strategic importance and it peaked in year FY 2007-08 and only marginally declined in the following years of economic crisis.
2010-2011
At the end of 2009, the Indian economy was growing at a rate of 7%. The strongest growth was coming from the manufacturing and construction sectors. In 2009-10, the economy grew by 8.4%, higher by 40 basis points. The growth of the secondary sector, which includes manufacturing and construction sectors, stood at 7.2 % in 2010-11. In addition, the GDP growth estimate for FY10 has been revised upward to 8.4 % from the previous estimate of 8%. Agriculture recorded 7% growth in 2010-11 as against a mere 1 % in 2009-10. Finance, insurance, real estate and business services grew by 10.4 %.
The strong rate of economic growth boosted prospects for the Indian currency in 2010. With such a high rate of growth, interest rates were likely to be higher in India than elsewhere. It could make India an attractive place for depositing money.
The drawback of such a rapid economic expansion was the rise in inflation and prospects of more inflation in 2010. In the middle of 2009, the official inflation rate was briefly negative, but this was due to prices being much higher in the previous year. More troublesome was the food price inflation, which touched 15%. This hit the poor and threatened to widen the gulf of inequality.
2012-2014
India’s economic growth rate hit a new low of 4.5% in the fiscal year 2012-13 and could be attributed to a sharper-than-projected slowdown in construction and mining sectors coupled with an upward revision of growth data for the previous fiscal year.
The first revised estimates released by the Central Statistics Office (CSO) showed mining production contracted by 2.2% instead of growing by 0.4%.Construction saw the sharpest deceleration of 1.1% against the earlier CSO estimate of 5.9% acceleration, while financial services and real estate grew at a faster trot of 10.9% compared with the 8.6% estimated earlier. Community services representing government expenditure expanded by just 5.3% as against 6.8% projected earlier, an indicator of the sharp spending cuts.
India’s economy faced its sharpest downturn for a decade. High borrowing costs and delays in securing mandatory government approvals stalled corporate investments and crimped cash flows, while high inflation and slower hiring shook consumer confidence and forced households to cut spending.
The CSO also revised growth rates for the previous two years. The 2010-11 gross domestic product (GDP) growth rate was revised down to 8.9% from 9.3% estimated earlier, while the 2011-12 GDP growth rate was revised upwards to 6.7% from 6.2% estimated earlier.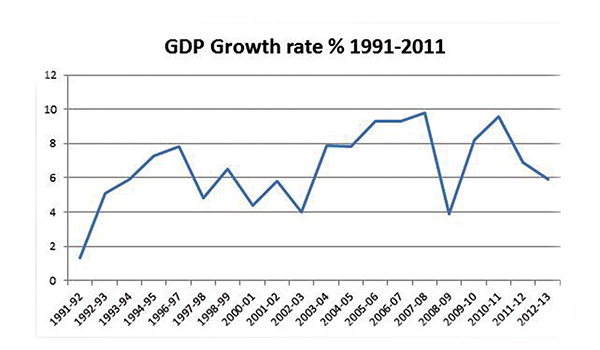
2014-2017
The ‘Make in India’ Initiative was launched in September, 2014 as a part of the government’s renewed focus on invigorating the country’s manufacturing sector. The ‘Make in India’ initiative has made a tremendous impact on the investment climate of the country as shown by significant growth of 46% in Foreign Direct Investment (FDI) equity inflows and the highest ever FDI inflows of $ 55.5 billion in 2015-16. After the launch of ‘Make in India’ initiative, India has emerged as the fastest growing major economy with GDP growth rate above 7.6% in 2015-16 and projected to grow above 7% till 2020.
The GVA (Gross Value Added) growth rates of agriculture & allied, industry, and services sectors were 9.64%, 8.32%, and 11.87%, respectively. At constant prices, GVA, GNI (Gross National Income), and NNI (Net National Income) growth of India was estimated at 6.67%, 7.17% and 7.24%, respectively.
According to the IMF, World Economic Outlook (October-2016), GDP growth rate of India in 2016 was 7.6% and it was the 4th fastest growing nation of the world.India’s GDP grew by 6.3 % in July-September 201. Corporate earnings in India are expected to grow by over 20% in FY 2017-18 supported by normalisation of profit.India has retained its position as the third largest start-up base in the world with over 4,750 technology start-ups and about 1,400 new start-ups being founded in 2016, according to a report by NASSCOM. Indian companies raised `1.6 trillion ($ 24.96 billion) through primary market in 201. India received net investments of $17.412 million from FIIs between April-October 2017. The top 100 companies in India are leading in the world in terms of disclosing their spending on corporate social responsibility (CSR), according to a 49-country study by global consultancy giant, KPMG. India’s ranking in the world has improved to 126 in terms of its per capita GDP, based on purchasing power parity (PPP). India is expected to have 100,000 start-ups by 2025, which will create employment for 3.25 million people and $ 500 billion in value, as per T V Mohan Das Pai, Chairman, Manipal Global Education.
India received the highest ever inflow of equity in the form of foreign direct investments worth $ 43.4 billion in 2016-17 and has become one of the most open global economies by ushering in liberalisation measures.
India is expected to be the third largest consumer economy as its consumption may triple to $4 trillion by 2025, owing to shift in consumer behaviour and expenditure pattern, according to a Boston Consulting Group (BCG) report and is estimated to the US to become the second largest economy in terms of purchasing power parity (PPP) by the year 2040, according to a report by PricewaterhouseCoopers.
Add new comment